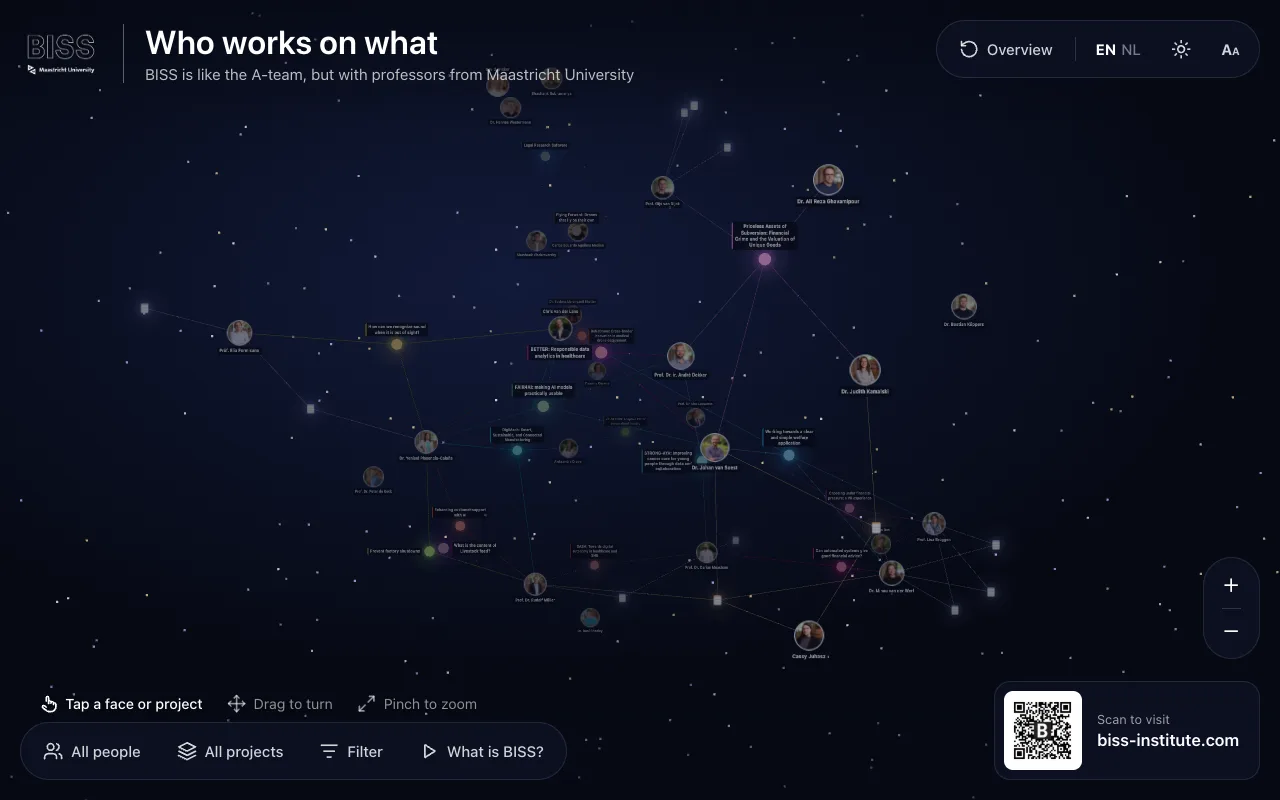
The institute’s people and projects as one graph, on the touch screen in its office.
A 3D graph of BISS: its researchers and engineers, the projects they work on, and the links between them. Tap a face or a project to read about it, drag to turn, filter by people or projects. Between visitors it plays showcases: what BISS is, where it sits on the Brightlands campus, its team and its projects.
Colleagues started it in 2024. In October 2026 I redesigned it for the office touch screen: the kiosk mode and its showcases, light and night themes, Dutch, recovery on its own from a lost GPU context or a stalled idle loop, usage analytics, and the deployment on the institute’s Coolify.
Showcases between visitors, a heartbeat that reports memory use, and a fresh start every half hour.
nginx imageCoolify
The static build, served from the institute’s Coolify.
The story
01What it is
A touch screen in the BISS office shows who works on what: the team and its projects as one graph you can turn, zoom and filter. Tapping a face or a project opens its page from the institute’s website.
02Built to run unattended
A screen on a wall has no one to reload it. Between visitors the graph plays its showcases, and it starts afresh every half hour. When the browser loses its GPU context or the idle loop stalls, it recovers by itself, and a heartbeat reports its memory use so a slow leak shows up before the screen goes dark.
03My part
Colleagues built the first version in 2024. My work, in October 2026: the redesign for the touch screen, the showcases, the themes and Dutch copy, the recovery and analytics, and moving it onto the institute’s Coolify.
Ask Wick
Answers from this site, David’s GitHub and his press
Hi, I’m Wick. I run on the same server as David’s projects, so I’ve watched most of them get built. Ask me anything about him.
AI answers can be wrong; the linked pages are the source. Questions aren’t stored.